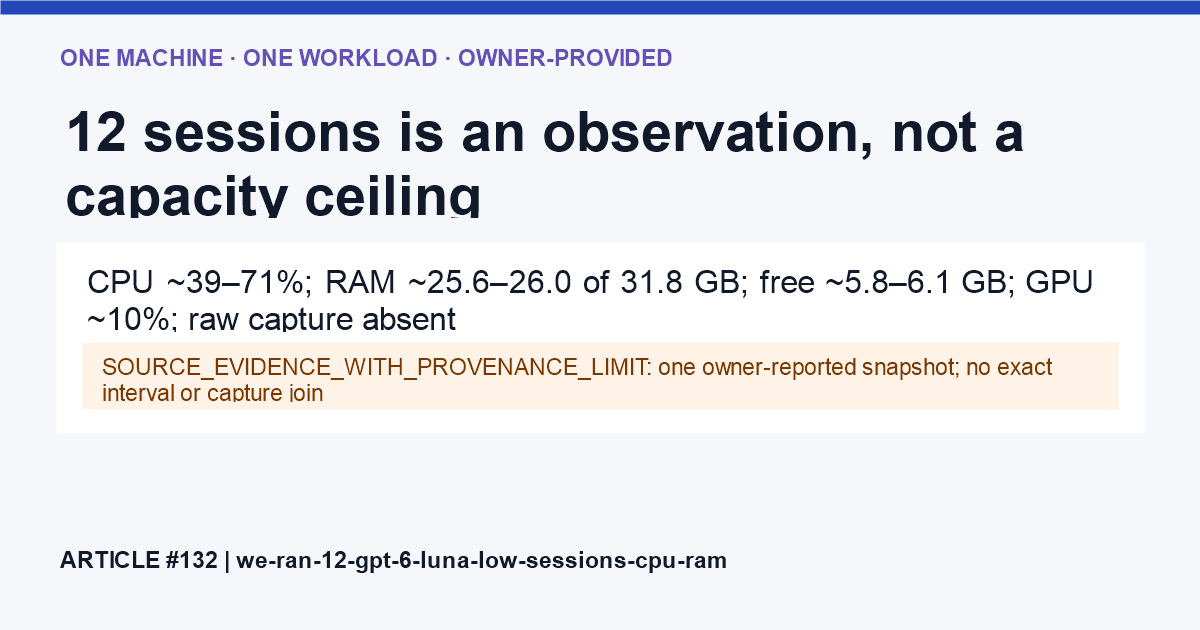
Evidence label: OBSERVED ON ONE MACHINE / ONE WORKLOAD. The CPU/RAM/GPU ranges below are owner-provided. The raw screenshot/log and exact sampling window were not attached to the public record, so this is not a controlled benchmark or concurrency ceiling.
View the full infographic → · View this article
Twelve concurrent GPT-6 Luna Low OpenCode sessions were reported on one desktop. The snapshot suggests memory may be the first local pressure point, but it does not isolate causes or say how many sessions this machine can reliably support.
Observed readings
| Resource | Reported observation | Limit |
|---|---|---|
| CPU | ~39–71% | Observed range; not an average or per-core trace. |
| RAM | ~25.6–26.0 GB used of 31.8 GB | Owner-supplied range; no process-to-lane attribution. |
| Free RAM | ~5.8–6.1 GB | Same observation window; sample cadence not attached. |
| GPU | ~10% | No engine/process attribution; does not identify the source of use. |
| Disk | Negligible | No numeric read/write or latency series supplied. |
Machine context
A separate read-only workstation inventory checked on 3 October reports Intel Core i5-14400F (10 physical cores, 16 logical processors), 31.78 GiB physical RAM, AMD Radeon RX 9060 XT, Windows 11 Home build 26200 and OpenCode 1.18.31. This is the current machine context, but the 12-session summary has not been bound to a timestamped raw capture from that inventory. The hardware list must therefore not be mistaken for a synchronized benchmark manifest.
What can be said now
Owner interpretation: RAM appears to be the first local constraint in this observation; CPU retains meaningful headroom; local GPU use was not the cloud Luna inference bottleneck. That interpretation is plausible for the reported snapshot, not a causal or universal conclusion. The ~10% GPU reading is not separated into Windows, browser, terminal or other engine use.
The observation does not establish per-lane RAM cost, linearity, a 24-lane ceiling, verified output per hour, allowance burn, or whether 64 GB would improve accepted throughput. The current sample is 12 lanes only. Lane IDs, session-to-job joins, run start/end, sample cadence, failures, retries and verifier outcomes are not attached.
Next experiment
Compare 5, 8, 12, 16, 20 and 24 lanes under a fixed task mix and acceptance test. Capture idle baseline, total/available RAM, commit/pagefile, CPU by core/frequency, GPU engine use, disk latency, lane starts/ends, retries, failures, provider usage and verified outputs. Add a stop condition before running. Test 64 GB on the same CPU separately rather than extrapolating.
Follow the open questions in Research Questions, see the visual snapshot, and use the agent rules tool to plan bounded retries and checkpoints. We have not tested the 24-lane or 64-GB scenario.